I, like most people, used to use the Ecommerce Sales Performance report in Google Analytics to get an idea of which channels were generating sales … until I realized the data is mostly useless. Oddly it was a new feature in Analytics itself which proved it.
Today I’ll show you how to check if your Sales Performance data is worth the pixels it is displayed in and how to find the real source or your customers or goal converting visitors.
The Sales Performance report
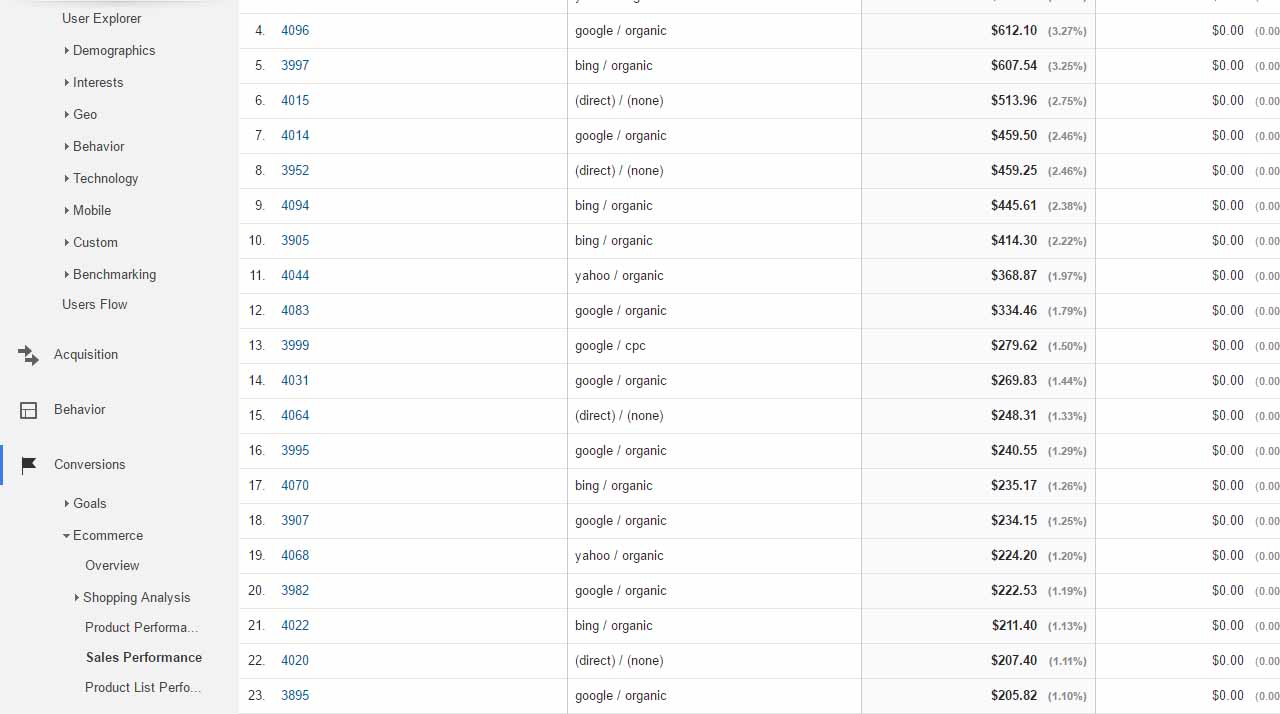
If you’ve never even used this basic data source you’ll find it under Conversions > Ecommerce > Sales Performance. At the top of the table of data click the Secondary dimension button and choose Acquisition > Source / Medium. You’ll see a report that looks something like this:

Google Analytics basic sales performance report
Its possible to change the Secondary Dimension to show particular Adword campaigns if you need the detail but basically you have data which can be downloaded into a spreadsheet, flipped and twiddled and leaving you in a comfort bubble that you know what sort of revenue each channel is bringing you.
But how true is it? Not very a great deal of the time.
The Source/Medium or whatever other secondary dimension you choose as the Acquisition only reports how the buyer entered the site when they made the purchase.
If I clicked a Google Ad last week, for example, saw what I wanted but returned to the site directly yesterday and purchased the product then the Sales Performance report would mark this as a ‘direct’ visitor who purchased. If I then want to buy something else next month from the same site but I can’t remember if it is a .com, .eu, .whatever so I search the brand name in Google and then purchase, for this transaction I would be reported as coming from ‘Organic’.
the Sales Performance report for that site would then say:
- 0 sales from cpc
- 1 sale from direct
- 1 sale from organic
In other words anything but the truth! This has big implications for anyone trying to figure out where your effective traffic comes from, especially if you are spending heavily on cpc platforms like Google Adwords.
Enter User Explorer
Back in April Google Analytics introduced User Explorer (in the Audience menu) which meant you could now see, user by user, customer by customer, exactly what people were doing on your site. When they first arrived, where they first arrived, how many times they visited before making a purchase, etc.
If you change your Analytics segment to ‘converters’ User Explorer will then show only visitors who got to one of your goals or purchased a product which is handy for finding out more about those who actually convert rather than visitors in general.
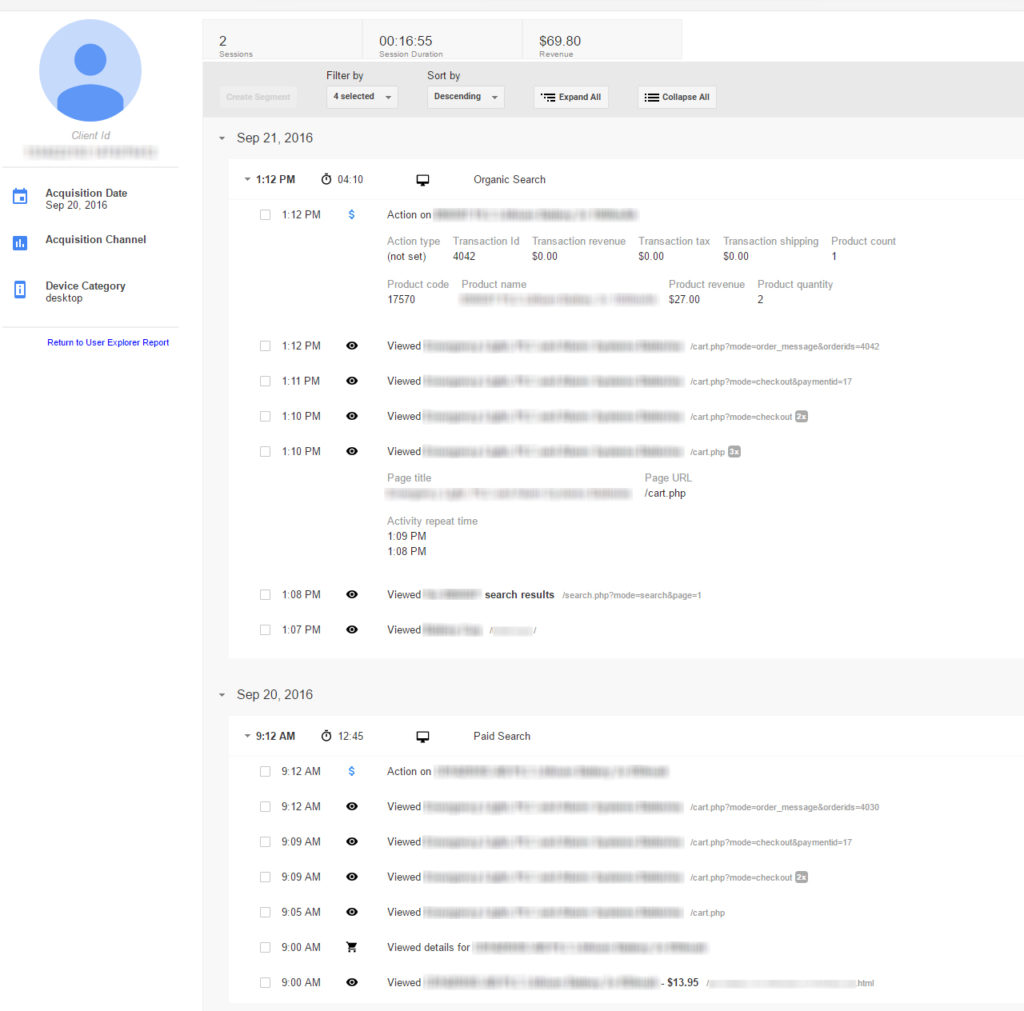
When I first started analyzing this info what I saw very quickly were a whole lot of visitors like this:

A sample user profile in Google Analytics User Explorer
This person had discovered the website on the 20th September via a PPC campaign and made a purchase. That bit would be correct in the Sales Performance report. However the next day he returned to the site to buy another product. This time the visit is recorded as organic but I can see he entered via the home page so the chances of it really being organic are low – he probably just searched the brand name.
From there he searched the site for a product, put it in his cart and bought it.
The reality is 2 sales due to cpc but recorded by the Sales Performance report (incorrectly) as 1 sale due to cpc and 1 sale due to organic search. As the company that carries out SEO for this site I’m very happy to take the credit but it doesn’t do me any good if I’m basing future actions, such as deciding whether or not to drop an Adwords campaign, on duff data.
Now sniffing around individual customers might be interesting for a while (and probably a little disturbing for that customer if they knew how much you know of their tiniest movements) but its really just a lot of individual bits of data that need to be aggregated.
Aggregating with Multi-Channel Funnels
Luckily Analytics aggregates User Explorer data although not quite perfectly and not anywhere near User Explorer. But first things first, you need to assess how badly skewed your data is in the Sales Performance report and you’ll find that information way down in the left hand menu of Analytics under Conversions > Multi-Channel Funnels > Assisted Conversions.
Here we can see how many sales were made, and how much revenue was generated by more than one channel. It looks something like this for one of my clients:

Google Analytics Assisted Conversions report
Note, and very important, at the top of the page there is a ‘Lookback Window’ box. Make sure this is set to ’90’ to get the most accurate data.
In this example where I looked at sales on one particular day 49 transactions (37% of all transactions) and $4,794 (42% of all revenue) happened after the buyer entered the site via two or more channels at two or more different times. This tells us that the basic data in the Sales Performance report is likely to be very skewed.
Also in the same menu is Time Lag which shows how many days after first visiting your site it takes before the visitor actually purchases. This won’t exactly match the Assisted Conversions figures because Time Lag works in days wile Assisted Conversions works in sessions. (close your browser and open it again and you have started a new session).
We now know the basic source/medium data in the Sales Performance report is duff, or around 40% duff. So how do you dig out the truth?
Customer sources in Multi-Channel Funnels
This, you will find under Top Conversion Paths. Here all the different channel paths that users have taken are listed and those users grouped together. Here’s how one of mine looks:

Google Analytics Top Conversions Paths report
Looking at the first row I can tell that 11 sales were made by people who came first via organic search and then returned later directly – possibly via a bookmark or because they remembered the domain name. That’s 11 transactions that were down to SEO which won’t show as such in the Sales Performance report.
We can also filter by Adwords campaigns to test which are really effective and a bundle of other options so we can really get to know what is working in delivering converters.
But what page did these people find via orgarnic search? Click the Secondary dimension button, select Acquisition > Landing Page URL Path and you get …. a complete mess! Yes, now is a good time to download the data as a csv file and put it in a spreadsheet.
But what about brand searches?
OK – as I mentioned yesterdaty the data still isn’t perfect. We know the real root reasons for our sales but we still have to deal with that awkward issue – users who search brand name and then click through to the site because they show up as Organic when they are really Direct.
For this we need to check Google Search Console. Go to Search Traffic > Search Analytics and then in the top menu select Pages. Find your home page (usually just ‘/’) and click the double arrows next to it on the right hand side of the screen. Now from the top menu select Queries. In almost all cases you’ll find the vast majority, if not all, of the clicks from Google are from people searching the brand name.
In this case, in your spreadsheet, make sure all cases where the home page is the first page and the channel is listed as ‘Organic’ are changed to ‘Direct’. Now you have data worth analysing.
